Data Visualization
Lecture 1
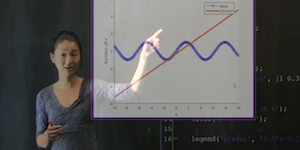
PLOTTING : We demonstrate the basic plotting capabilities of MATLAB.
MATLAB COMMANDS
PLOT
Lecture 2
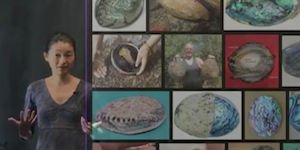
DATA VISUALIZATION : Key features of data visualization are explored.
MATLAB COMMANDS
FOR IF
Lecture 3
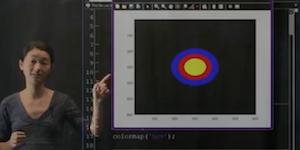
COMMUNICATING WITH DATA: The ability to communicate meaningful results through graphics is critical for data exploration.
MATLAB COMMANDS
RESHAPE IMRESIZE FLIPUD IMSHOW RGB2GRAY
MATLAB CODE